Process Analytical Technology Market Size & Share Analysis - Trends, Drivers, Competitive Landscape, and Forecasts (2025 - 2032)
This Report Provides In-Depth Analysis of the Process Analytical Technology Market Report Prepared by P&S Intelligence, Segmented by Technique (Spectroscopy, Chromatography, Capillary Electrophoresis, Particle Size Analysis), Measurement (In-Line, At-Line, On-Line, Off-Line), End User (Pharmaceutical Manufacturers, Biopharmaceutical Manufacturers, Contract Research and Manufacturing Organizations), Offering (Products, Services), and Geographical Outlook for the Period of 2019 to 2032
Explore the market potential with our data-driven report
Process Analytical Technology Market Future Prospects
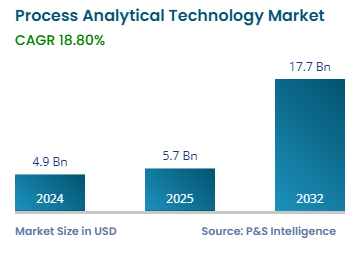
The process analytical technology market size is estimated to generate USD 4.9 billion in 2024, and it is expected to grow at a CAGR of 18.8% during 2025–2032, to reach USD 17.7 billion by 2032. This is because PAT has been included in the processes used to produce end products, such antibiotics, pharmaceuticals, and vaccines, as a result of the increased need for quality-based products across industries, including pharma and biotech. PAT also facilitates quicker process development and scale-up, while decreasing downtime and enhancing yield.
Moreover, top pharma companies are investing heavily in this field. For instance, Sun Pharma and Cipla spent around USD 340.0 million and USD 167.0 million, respectively, on pharmaceutical R&D. Moreover, Indian pharma companies spend 8.0–13.0% of their total turnover on R&D. Thus, the surging R&D expenditure across the world is leading to the rising demand for PAT tools.
Another factor responsible for the growth of the market is technological advancement in analytical devices. Major players involved in the development of PAT tools are advancing these devices. Moreover, during the COVID-19 pandemic, the demand for these devices increased in order to supply rapid testing solutions. For instance, Shimadzu Corporation and HORIBA Ltd., in 2021, released a new LC–Raman system that combines a Shimadzu HPLC with a HORIBA Raman spectrometer. This system increases measurement accuracy and efficiency and is expected to offer new measurement values by detecting unknown components.
Process Analytical Technology Market Trends and Growth Drivers
Outsourcing of Manufacturing Processes Is Key Industry Trend
The trend of outsourcing the manufacturing of pharma products continues to burgeon around the world.
From around USD 17.1 billion, global revenue for biologics CDMO is set to rise to USD 31.8 billion by 2030.
This is due to various advantages they offer, such as a lower cost of production, lower capital investment, desired quality, time-saving, and flexibility to pharma companies to divert their resources to other areas, such as marketing.
Additionally, outsourcing allows for easier compliance with the regulations of various bodies.
For instance, Arvinas Inc. and Pfizer Inc. have a global collaboration to develop and commercialize ARV-471, an investigational oral proteolysis-targeting-chimera (PROTAC) estrogen receptor protein degrader.
Similarly, Samsung Electronics Co. Ltd. has entered the contract manufacturing space in the biopharmaceutical industry with the diversification of its business in the form of Samsung Biologics.
Samsung Biologics entered this space to focus on manufacturing generic versions of biologics and offering biomanufacturing outsourcing for Big Pharma.
Under it, the company will provide end-to-end CDMO services, including cell line development, and clinical drug manufacturing, to support investigational new drug (IND) filings for anti-HIV and anti-SARS-CoV-2 monoclonal antibodies.
Moreover, the contract manufacturing industry is expected to grow significantly in the future, especially in emerging economies, to meet the surging need for pharma products, thereby supporting the demand for PAT.
Growing Adherence to QbD Principles Drives Market
The QbD principles given by Joseph M. Juran, a quality expert and management consultant, are used to advance product and process quality in various industries.
These principles emphasize that quality can be planned and that most quality problems are associated with the way in which the quality was planned.
QbD is an emerging practice to ensure safe, effective drug supply to consumers and significantly improve manufacturing quality and performance.
The principles have been adopted by the USFDA for the discovery, development, and manufacturing of drugs.
In 2002, at the USFDA’s Office of New Drug Quality Assessment (ONDQA), a new risk-based pharmaceutical quality assessment system (PQAS) was recognized based on the application of process and product understanding.
Additionally, a pilot program was implemented to allow pharma manufacturers to submit information for a new drug application (NDA) demonstrating the use of these principles, process understanding, and product knowledge.
In January 2011, the USFDA released a process validation guidance that records the requirement of organizations to continue benefiting from the information gained and continually improving the process lifecycle, by making revisions to guarantee that the root causes of manufacturing glitches are rapidly corrected.
Moreover, in January 2013, the USFDA began the process to implement the QbD principles into their Abbreviated New Drug Applications (ANDA), Module 3 Quality 3.2.P.2 Pharmaceutical Development, for generic drug manufacturers.
The aim is to propose a control strategy that includes input material attributes and process parameters identified as potentially high-risk variables during the initial risk assessment.
Additionally, it includes in-process and finished product specifications.
The process is monitored during the lifecycle of the product, and the additional knowledge gained is utilized to make adjustments to the control strategy, as appropriate.
With such regulations around the world, adherence to the QbD principles is increasing among pharma and biopharma companies, thereby promoting the implementation of advanced PAT.
Process Analytical Technology Market Analysis
Technique Analysis
The spectroscopy category held the largest market share, of 50%, in 2024, and it is projected to attain the fastest growth during the forecast period. This is attributed to the increasing pharmaceutical and biopharmaceutical R&D activities and technological advancements resulting in process optimization. Moreover, spectroscopy helps in the determination of the atomic structure of a sample and the molecular structure of the muscle, monitoring of dissolved oxygen content in freshwater and marine ecosystems, studying of the emission lines of distant galaxies, alteration of drug structure to improve effectiveness, characterization of proteins, space exploration, and respiratory gas analysis in hospitals.
In addition, molecular spectroscopy has been the most widely used spectroscopy technique. The category is also expected to experience considerable growth during the forecast period, due to its wide application and increasing demand in the pharmaceutical and biopharmaceutical industries.
These techniques are covered:
Spectroscopy (Largest and Fastest-Growing Category)
Molecular
Atomic
Mass
Chromatography
Liquid chromatography (LC)
Gas chromatography (GC)
Capillary Electrophoresis
Particle Size Analysis
Others
End User Analysis
Pharmaceutical manufacturers accounted for the largest revenue share in 2024. This is because PAT acquires an important role in the process development and scaling up the asymmetric syntheses of chiral molecules, including active pharmaceutical ingredients, in the pharmaceutical industry.
The biopharmaceutical manufacturers category is expected to witness the fastest growth during the forecast period, with 20% CAGR. This is owing to the growing biotechnology industry and the rising demand for biochemical analysis due to the approval and launch of various biologic drugs.
The in-line measurement led the market in 2024, with 40% revenue share, and it is expected to attain the same position in the coming years. With batch production being widely employed in the pharmaceutical industry, in-line measurements are the most-widely utilized measurements as part of PAT projects.
The on-line measurement category at the highest CAGR during the forecast period due to the low turnaround time and consistency in results obtained by on-line analysis. Moreover, with the advancements in PATs, on-line measurements are being adopted at a high rate in developed countries.
These measurements are covered:
In-Line (Largest Category)
At-Line
On-Line (Fastest-Growing Category)
Off-Line
Offering Analysis
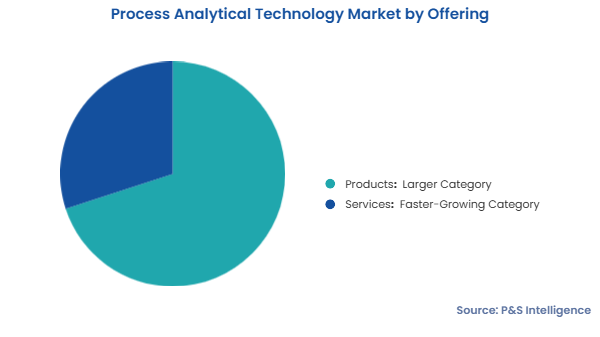
The products category dominated the market in 2024 with a share of 70%. Products in the global PAT market include analyzers, sensors and probes, and samplers. The increasing drug discovery and development activities and stringent regulations for drug safety are stimulating the demand for PAT products.
The services category is expected to register the faster growth, at a CAGR of 20.5%, during the forecast period due to the increasing demand for chemometrics and statistics data processing services.
These offerings are covered:
Products (Larger Category)
Analyzers
Sensors and probes
Samplers
Services (Faster-Growing Category)
Drive strategic growth with comprehensive market analysis
Process Analytical Technology Market Geographical Outlook
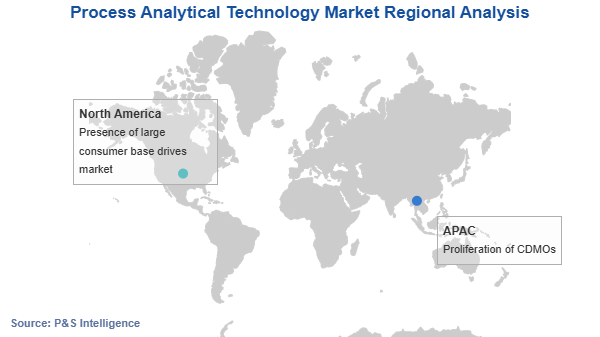
North America held the largest share in the global PAT market in 2024, of 40%. The market in these countries is expected to grow on account of the rising R&D expenditure by pharmaceutical and biopharmaceutical companies, surging investments by governments, increasing focus on quality and manufacturing efficiency improvement, and growing adherence to QbD principles by companies operating in these countries.
The presence of the majority of global PAT manufacturers and regulatory authorities that have stipulated strict quality standards to comply with for pharmaceutical companies, growing biotechnology industry and consequently increasing use of analytical technologies, and high R&D expenditure by pharmaceutical companies in the region are some of the key factors driving the market in the region. The presence of the major players has led to a high sale of such solutions to the pharmaceutical and chemical industries of the region.
The U.S. holds the larger share in the North American PAT market, mainly attributable to the larger size of the pharmaceutical industry in the country, high R&D expenditure, and presence of various large players providing PATs in the country. Moreover, the Pharmaceutical Research and Manufacturers of America (PhRMA) trade group represents the leading biopharmaceutical research companies in the U.S. In 2023, the R&D expenditure of its member companies reached around USD 96 billion.
The APAC PAT market is expected to witness the highest CAGR, of 22%, during the forecast period. This can be ascribed to the presence of various USFDA-approved pharmaceutical companies, the rapid growth in the biotechnology industry along with the increasing use of analytical technologies, high R&D expenditure, a surge in the prevalence of various diseases that leads to a rise in the consumption of pharmaceutical and biologic drugs, and the increase in healthcare expenditure in the region.
For instance, according to the World Bank, healthcare expenditure as a percentage of the GDP in China increased from 5.17% in 2018 to 5.35% in 2019, 7.08% in 2022, and 7.19% in 2023. Similarly, India’s healthcare expenditure grew at a CAGR of 15.8% between FY 2018 and FY 2024, reaching INR 5.85 lakh crore, as per the Press Information Bureau.
Additionally, it is projected that the growing interest of international organizations in emerging markets and the expansion of contract research and manufacturing companies in the region would create new growth prospects for industry players.
Brazil (Largest and Fastest-Growing Country Market)
Mexico
Rest of LATAM
Middle East & Africa (MEA)
Saudi Arabia (Largest Country Market)
U.A.E. (Fastest-Growing Country Market)
South Africa
Rest of MEA
Process Analytical Technology Market Share
The market is fragmented as the offerings are diverse, including both products and services.
Moreover, the products include both common stuff, such as probes and samplers as well as complex analyzers.
Additionally, even more companies develop software for such machines; the increasing penetration of AI, big data analytics, and other cutting-edge technologies widens the opportunity for players.
The exact setup may need to be modified for application in different industries, further fragmenting the market.
The availability of numerous techniques also means that different companies possess varying expertise.
Major Companies in Process Analytical Technology Market:
PerkinElmer Inc.
Shimadzu Corporation
Carl Zeiss AG
Mettler-Toledo International Inc.
Emerson Electric Co.
ABB Ltd.
Danaher Corporation
Thermo Fisher Scientific Inc.
Agilent Technologies Inc.
Bruker Corporation
Merck KGaA
Siemens AG
Sartorius AG
Bio-Rad Laboratories Inc.
Waters Corporation
Process Analytical Technology Market News
In January 2025, Shimadzu Corporation introduced the upgraded model of its Brevis GC-2050 gas chromatography system, by including all major kinds of detectors, inlets, mass spectrometers, and pre-treatment devices.
In August 2024, Mettler-Toledo International Inc. launched the InSUS H30i reusable sensor head and InSUS 310i disposable pH sensor. Featuring noise and EMI resistance and the Intelligent Sensor Management technology, the combined solution enables more-accurate measurements of the pH, easy management of the sensors, and documentation of the entire analytical process.
In April 2024, Bruker Corporation launched the Ascend Evo 600, a new NMR magnet with a power of 14.1 Teslas and a standard bore of 54 millimeters. The magnet is offered for biopharma drug discovery & development, academic basic and clinical research, and process analytical technologies.
In April 2024, PerkinElmer Inc. launched its NexION 1100 ICP-MS mass spectrometer for trace element analysis.
Frequently Asked Questions About This Report
What was the process analytical technology market 2024 size?+
The total size of the market for process analytical technology was USD 4.9 billion in 2024.
Which region has the largest share in the process analytical technology industry?+
North America has the largest share in the process analytical technology industry.
What is the nature of the process analytical technology market?+
The market for process analytical technology is fragmented.
What are the biggest drivers for the process analytical technology industry?+
The major drivers of the process analytical technology industry include the rising pharmaceutical R&D spending, growing adherence to QbD principles, and technological advancements in analytical devices.
Which end user has the largest process analytical technology market share?+
Pharmaceutical manufacturers dominate the market for process analytical technology.
Want a report tailored exactly to your business need?
Leading companies across industries trust us to deliver data-driven insights and innovative solutions for their most critical decisions. From data-driven strategies to actionable insights, we empower the decision-makers who shape industries and define the future. From Fortune 500 companies to innovative startups, we are proud to partner with organisations that drive progress in their industries.
Client Testimonials
Working with P&S Intelligence and their team was an absolute pleasure – their awareness of timelines and commitment to value greatly contributed to our project's success. Eagerly anticipating future collaborations.
McKinsey & Company
India
Unmatched Standards
Our insights into the minutest levels of the markets, including the latest trends and competitive landscape, give you all the answers you need to take your business to new heights
Complete Data Security
We take a cautious approach to protecting your personal and confidential information. Trust is the strongest bond that connects us and our clients, and trust we build by complying with all international and domestic data protection and privacy laws